The Moneymunch editorial staff is a team of experienced financial writers and analysts with over a decade of experience in the financial markets. They have previously contributed to popular financial blogs and newspapers, and are passionate about providing accurate and up-to-date information to help both investors and traders make informed decisions. Trust the Moneymunch editorial staff to provide reliable and effective financial advice that can help you achieve your financial goals.
Important Note:We are going to discontinue support on the old app. This new app is available for compatible Android smartphones and BlackBerry as well as Windows Phone, iPhone, iPad, iPod touch, and Desktop.
Please log in and read this article to get a download link and features introduction.
Unlock This Article
Only subscribers can read the full article. Please login to read the entire article.
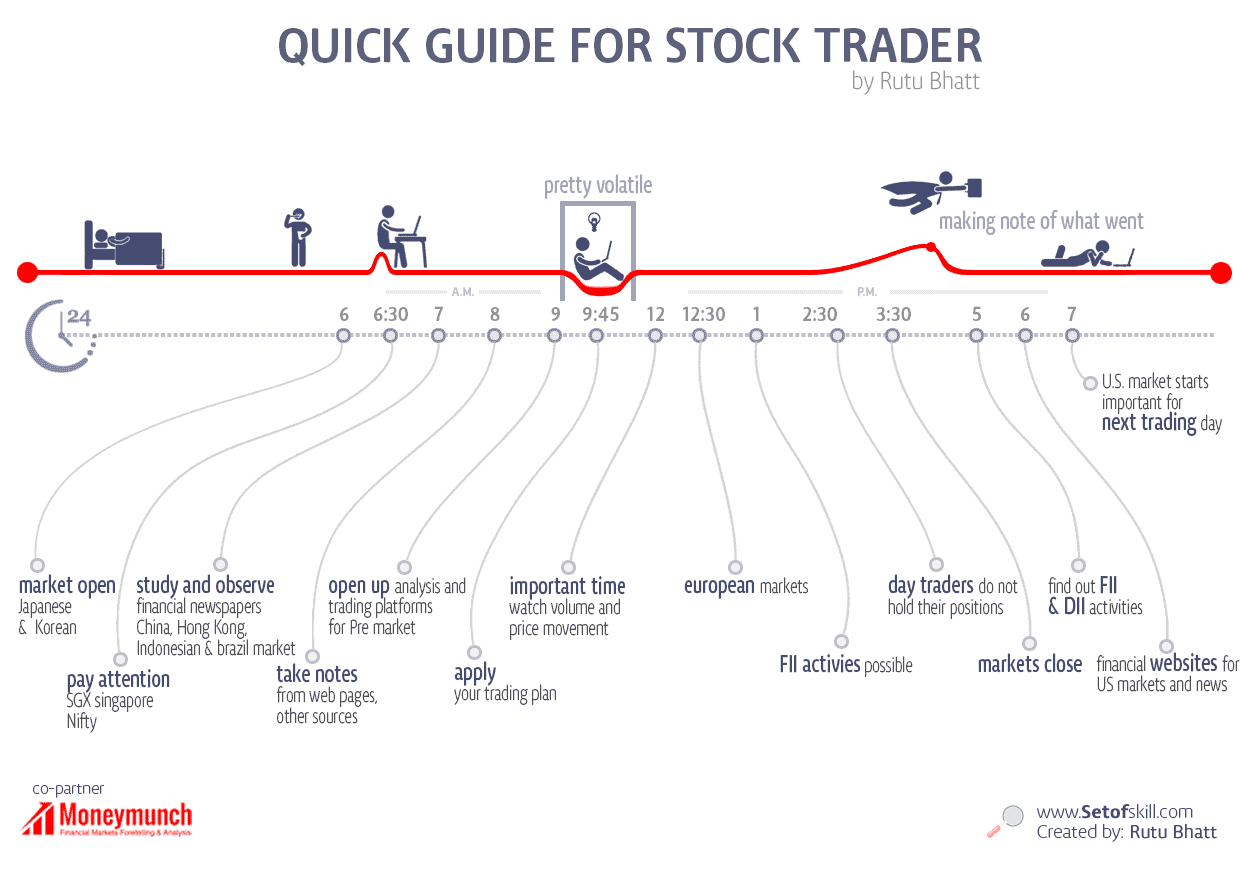
Starting “a stock trader” is the way of money making is riskier but, we found a way from a perfect trader who really earn. There are 3 trading styles: position trading, swing trading and day trading. If other succeed in day trading, you succeed. The way to making money for you looks like this:Continue reading
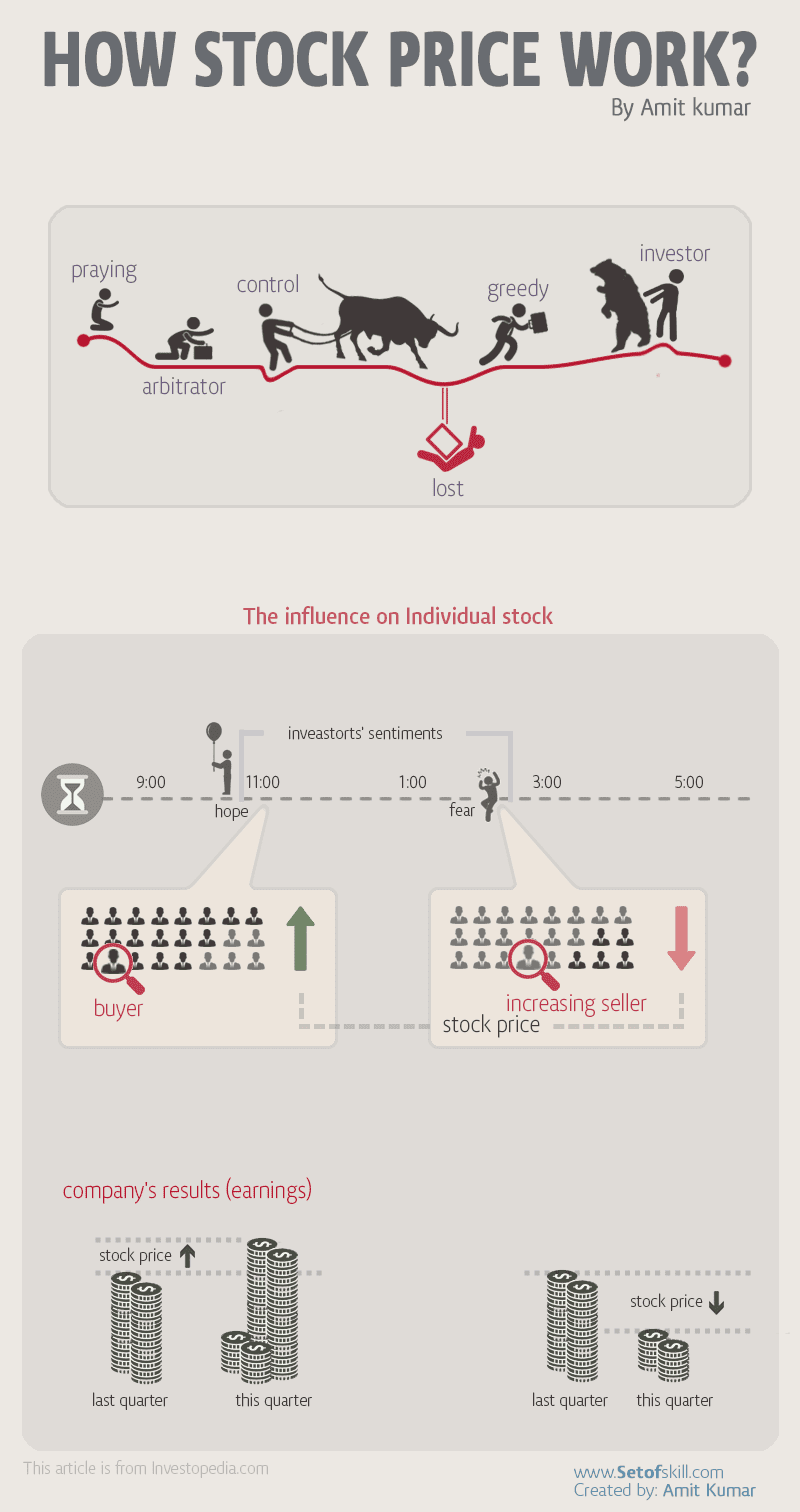
Here is a visualization of the How stock price works!
At the most fundamental level, supply and demand in the market determine stock price.
Price times the number of shares outstanding (market capitalization) is the value of a company. Comparing just the share price of two companies is meaningless.
Theoretically, earnings are what affect investors’ valuation of a company, but there are other indicators that investors use to predict stock price. Remember, it is investors’ sentiments, attitudes and expectations that ultimately affect stock prices.
There are many theories that try to explain the way stock prices move the way they do. Unfortunately, there is no one theory that can explain everything.
This is the 52th Day course in a series of 60-Days called “Technical Analysis Training”
You will get daily one series of this Training after 8 o’clock night (Dinner Finished)
Follow MoneyMunch.com Technical Analysis Directory and Learn Basic Education of Technical Analysis on the Indian Stock Market (NSE/BSE)
Triple Bottom Chart Pattern
A triple bottom pattern shows 3 different small lows at around the similar amount. The triple bottom is regarded to be a difference of the head and shoulders bottom. Like that pattern, the triple bottom is a reversal pattern.
The only option which distinguishes a triple bottom from a head and shoulders bottom is the lack of a “head” between the two shoulders. The triple bottom shows a downtrend in the procedure of becoming an uptrend. It is, therefore, vital to the validity of the pattern that it commence with prices moving in a downtrend.
Elaine Yager, Director of Technical Analysis at Investec Ernst and Company in New York and a member of Recognia’s Board of Advisors goes further to say that this pattern must commence with prices moving in a major downtrend – one that has lasted for one year or more.
What does a triple bottom appearance?
As highlighted below, the triple bottom pattern is consisting of three acute lows, all at concerning the same amount stage. Prices come to a assistance level, rise, fall to that help level also, rise, and subsequently fall, reverting to the assistance level for a third time earlier beginning an ascending climb. In their popular triple bottom, the ascending motion in the price marks the starting of an uptrend.
Triple Bottom In-depth
Traders should note that the 3 lows choose to be sharp. When cost struck the 1st low, suppliers become scarce, assuming prices have fallen too low. If a seller does consent to sell, buyers are easy to buy at a ideal price. Cost then jump back up. The maintain level is developed and the next two lows also are acute and quick. Bulkowski tips out that the acute lows are frequently only one-day climb.
This is the 51th Day course in a series of 60-Days called “Technical Analysis Training”
You will get daily one series of this Training after8 o’clock night (Dinner Finished)
Follow MoneyMunch.com Technical Analysis Directory and Learn Basic Education of Technical Analysis on the Indian Stock Market (NSE/BSE)
Symmetrical Continuation Triangle Bullish
Introduction
The triangle pattern, also called the “coil,” appearance in 3 designs:
1. symmetrical, 2. ascending, and 3. descending.
Commonly, a triangle pattern is actually regarded to be a continuation or combination pattern. Often, but, the configuration signifies a change of state of a trend.
Symmetrical triangles is commonly regarded as simple, climbing triangles are bullish, as well as climbing down triangles are bearish. Starting a duration point of view, triangles is in most cases regarded as to be advanced patterns. Normally, it takes longer than a month to form a triangle. Seldom will a triangle last longer then three months. In case a triangle pattern can bring extended than three months to finish, Murphy suggests that the configuration will consume on great trend importance.
What does a symmetrical triangle look like?
Converging trendlines of support and resistance provides the triangle pattern its unique pattern. This happens, Louis Isadore Kahn describes, considering “the investing motion becomes stronger and stronger till the market breaks or cracks away with awesome power.” Buyers and sellers discover on their own in a duration in which they tend to be not excellent in which the market is headed. His or her anxiety is labeled by any steps of buying and selling earlier, creating the pattern appearance such as an progressively close coil shifting around the chart.
Since the variety between the highs and troughs establishing the advancement of amount narrows, the trendlines satisfy at the “apex,” positioned at the ideal of the chart. The “base” concerning the triangle is the vertical line inside the remaining of the chart that measures the vertical peak of the pattern.
A symmetrical triangle shows two converging trendlines, one is ascending, the other is descending – generating a sidewise symmetrical triangle. The creation takes place because rates are achieving both the lower highs and higher lows. Elaine Yager, manager of Technical Analysis at Investec Ernst as well as Company in New York and a associate of Recognia’s panel of experts, notes which the pattern should exhibit two highs and two lows, every pressing the trendline because – a minimum of four change of state points is appropriate to bring the two converging trendlines. The diagram offers these types of points noted.
This is the 50th Day course in a series of 60-Days called “Technical Analysis Training”
You will get daily one series of this Training after 8 o’clock night (Dinner Finished)
Follow MoneyMunch.com Technical Analysis Directory and Learn Basic Education of Technical Analysis on the Indian Stock Market (NSE/BSE)
Rounded Top Chart Pattern
Implication
A Rounded Bottom is considered a bullish signal, indicating a possible reversal of the current downtrend to a new uptrend.
Description
The pattern is confirmed when the price breaks out above its moving average.
Important Characteristics
Following are important characteristic to look for in a Rounded Bottom.
Shape
The price pattern forms a gradual bowl shape. There should be an obvious bottom to the bowl. Price can fluctuate or be linear; however, the overall curve should be smooth and regular, without obvious spikes. For example, a V-shaped turn would not be considered a rounded bottom.
Volume
Volume tends to mirror the price pattern. Consequently, as the rounded bottom begins to descend, volume tends to decrease as bearishness wanes and investors become indecisive. Following a period of relative inactivity, at the bottom of the bowl, the price pattern starts its upward turn. As sentiment becomes more decisively bullish, volume tends to increase. When looking at volume in a rounded bottom pattern, Robert D. Edwards and John Magee note that “volume accelerates with the [price] trend until often it reaches a sort of climactic peak in a few days of almost ‘vertical’ price movement on the chart.”
Duration of the Rounded Bottom
Rounded Bottoms are long-term patterns. Martin J. Pring identifies that the pattern can occur over a period of about 3 weeks, but can also be observed over several years.
Trading Considerations
Duration of the Pattern
The duration of the pattern indicates the significance of the price movement. John J. Murphy writes that rounded bottoms “are usually spotted on weekly or monthly charts that span several years. The longer they last, the more significant they become.”
Target Price
Understandably, investors like to buy at the lowest possible price. However, even the most promising-looking rounded bottoms patterns can fail. To determine whether a downturn has bearish potential, watch the price at the bottom of the downturn. For a rounded bottom, the price tends to hover and bounce between an upper and lower price limit. You may observe this behavior for weeks or even years, as knowledgeable investors accumulate stock at the lowest possible price.
Clifford Pistolese advises that, “If well-informed, long-term investors are buying within the trading range, the eventual breakout will probably be to the upside.” To manage risk, both Pistolese and Thomas N. Bulkowski suggest that investors buy stock when the breakout actually occurs.
Price may end higher or lower than it was at the beginning of the formation. After an upside breakout, technical analysts may use the starting price at the left side of the bowl to determine where the price may head. However, you will want to monitor the stock with interest.
Criteria that Supports
Volume
Volume should parallel the price formation, dropping off as the pattern reaches the bottom, then increasing as the new uptrend is established.
Moving Average
Moving averages help to determine whether the rounded bottom has the potential for an upside breakout. For a rounded bottom, the price should cross the moving average when it begins to ascend. When this crossover occurs, the pattern is “confirmed”.
Criteria that Refutes
Shape
A development is not a real curved underneath when it does not include a duration of combination. Combination appears following the descent when the cost at the foundation of the structure seems to jump between an top and bottom restrict. While, there are V-shaped designs that give effective returns, the rounded bottoms are a more dependable and foreseeable enhancement
Underlying Behavior
A Rounded Bottom kinds as trader belief shifts slowly from bearishness to bullishness. As the opinion turns down toward the bottom, there is a fall off in investing amount due to the indecisiveness in the industry. There is a stage of combination at the bottom as investing bounces within a certain range, then finally there is a steady upturn tagging the shift to bullishness. As customers become additional significant regarding the bullishness, there is an enhance in trading volume.
Wishing you a wonderful learning experience and the continued desire to grow your knowledge. Education is an essential part of living wisely and the Experiences of life, I hope you make it fun.
Learning how to profit in the Stock Market requires time and unfortunately mistakes which are called losses. Why not be profitable while you are learning?
 Unlock This Article