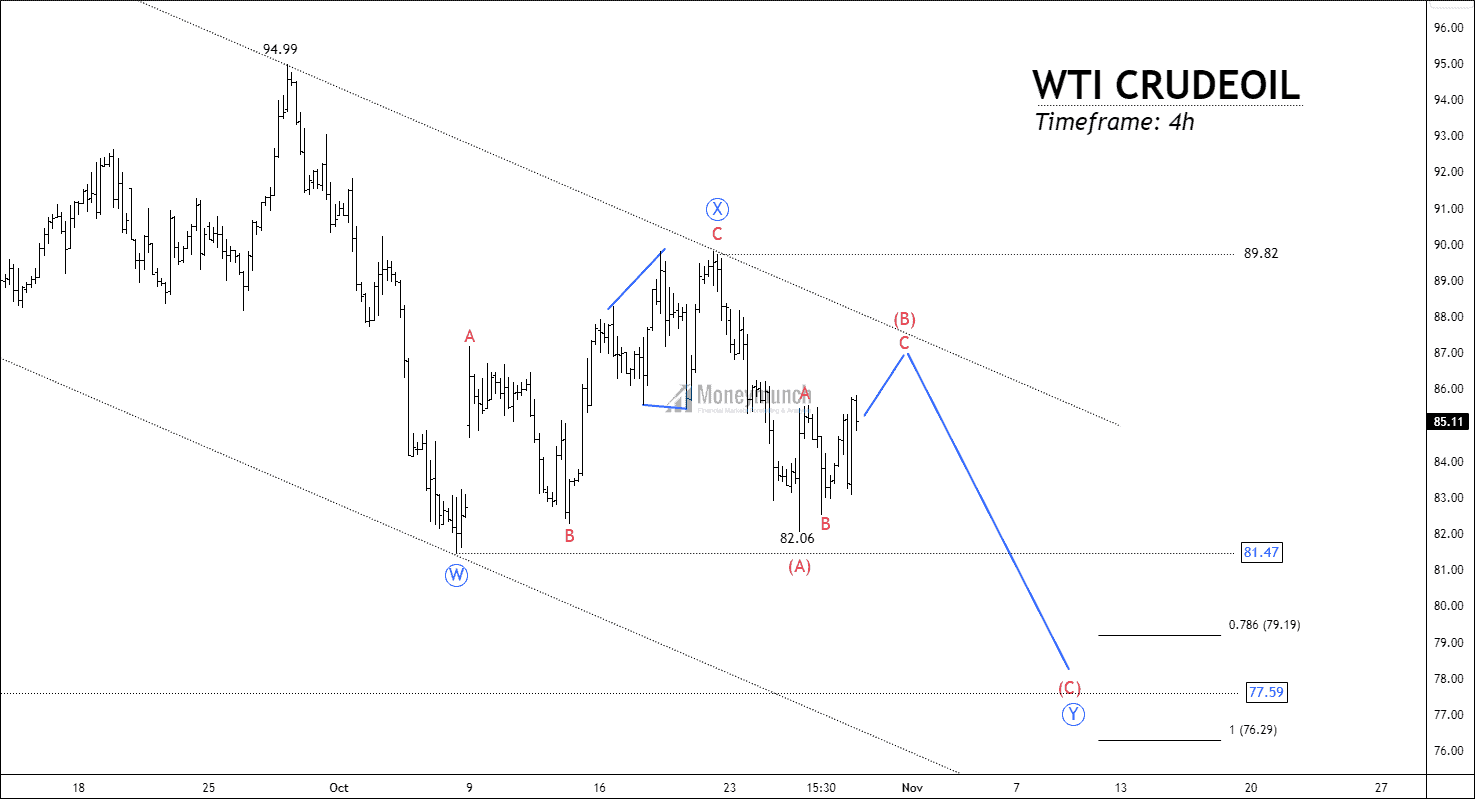
WTI CRUDEOIL – Elliott Wave Perspective
SPX – A Peculiar Reversal Or Straight Continuation
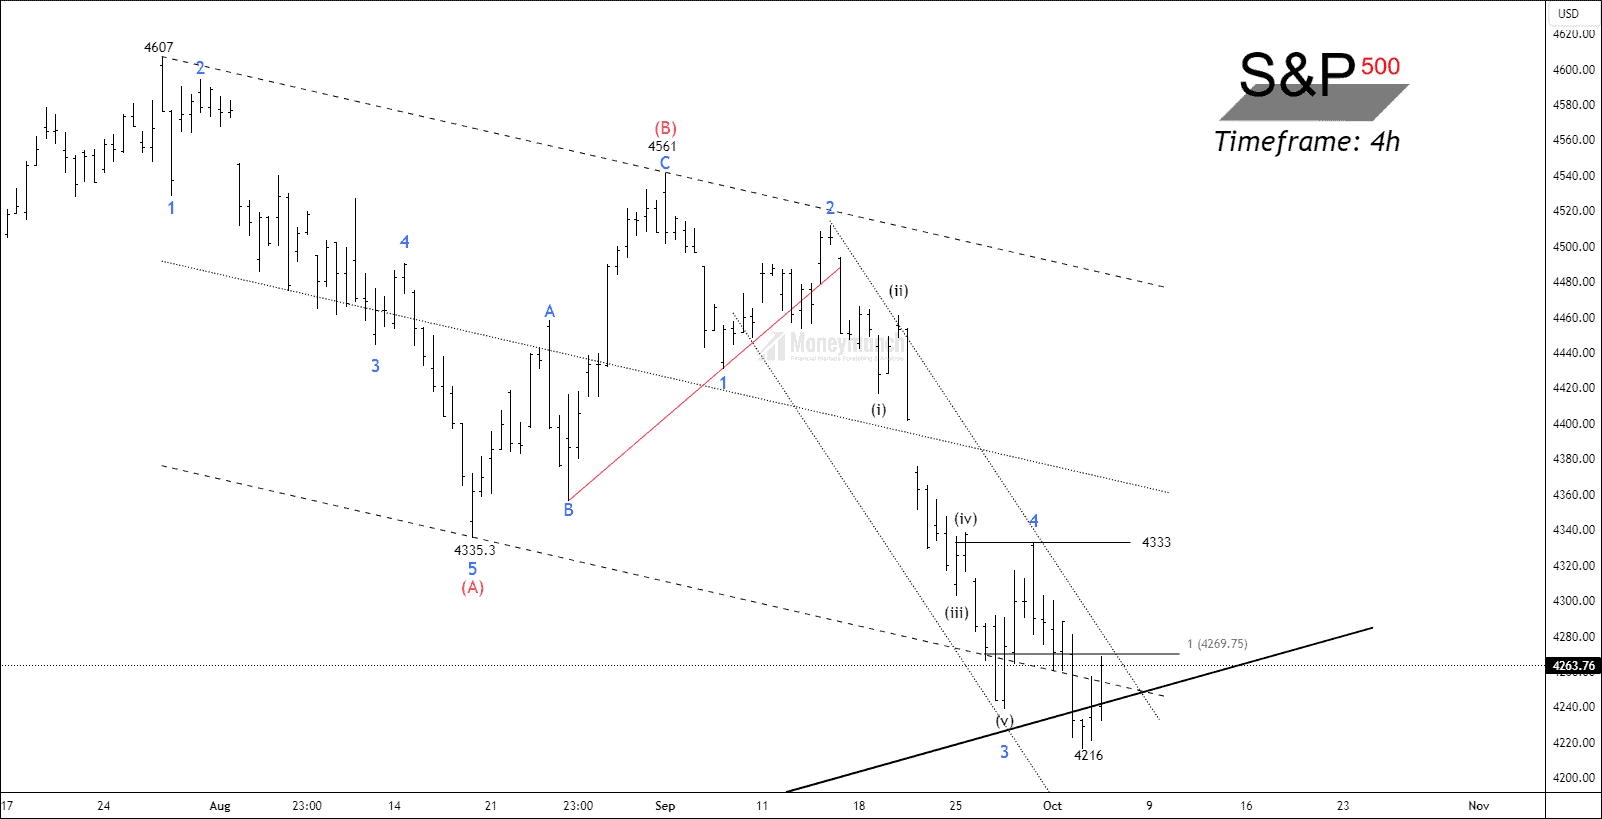
Timeframe: 4h SPX has formed a corrective A-B-C zigzag formation on the hourly timeframe chart. The price has accomplished wave (b) at 4561, creating the final wave C of the corrective wave (c). SPX has occurred sub-wave 4 at 4333 and started forming sub-wave (5) of wave (C). According to the Elliott wave principle, an impulsive cycle can only start after the breakout of the sub-wave (4). SPX has taken third support on the dynamic support line. Another clue could be the descending channel of subwave 2-4, and the breakout able to reach wave (B). If the price breakout wave sub-wave 4 of wave (C) at 4333, traders can trade for the following targets: 4416 – 4486 – 4540+. We can see that the mid-term trendline is holding the price movement, and failure to sustain above the dynamic support can lead to worse conditions even if the price has retraced 61.8% of the overall move. Moving averages are trading above the price, and a rising RSI shows the strenth is about to come. Premium subscribers will get trade setup with entry, exit, and invalidation levels.Continue reading
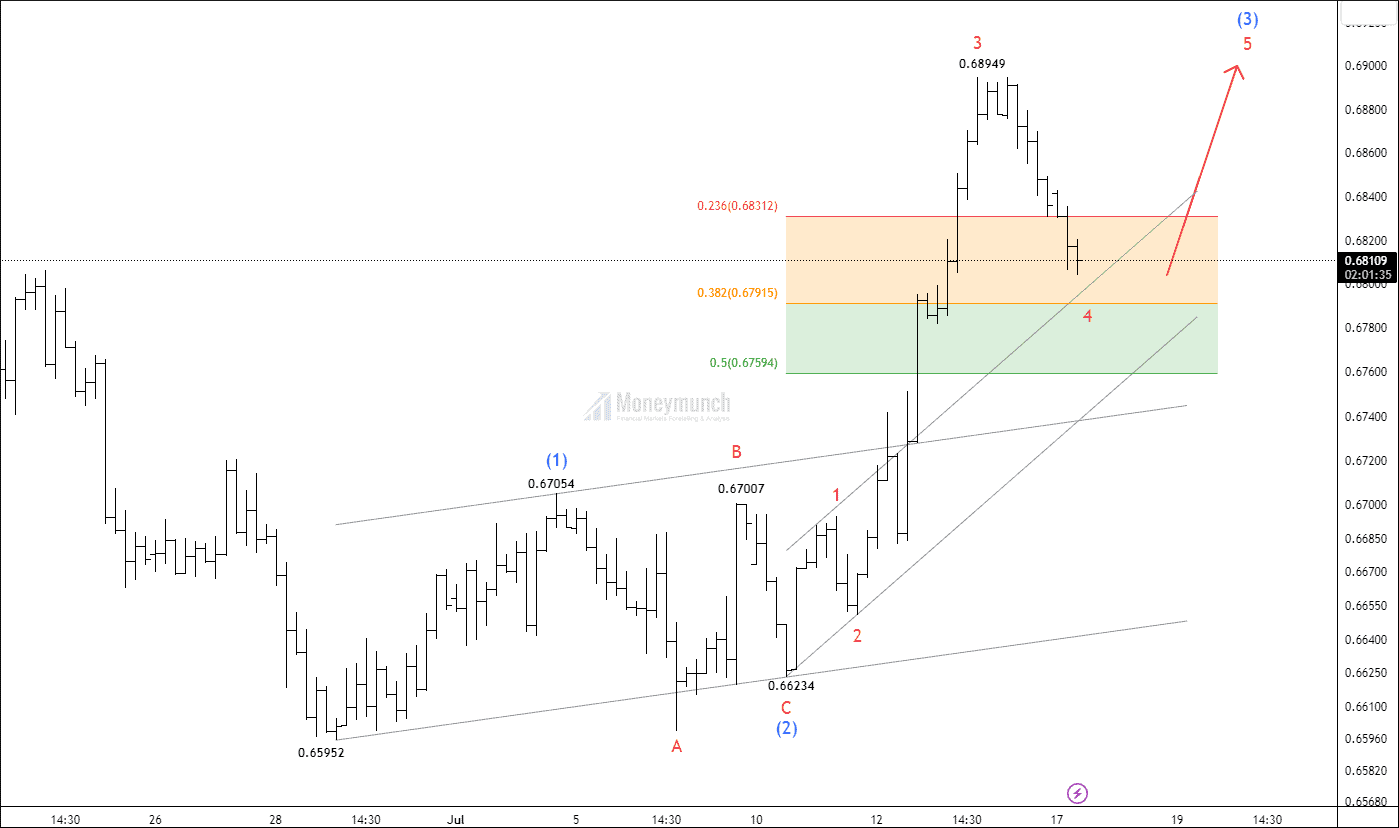
AUDUSD – Elliott Wave Projection
EWT – NYSE Mastercard Is Preparing Skyrocket
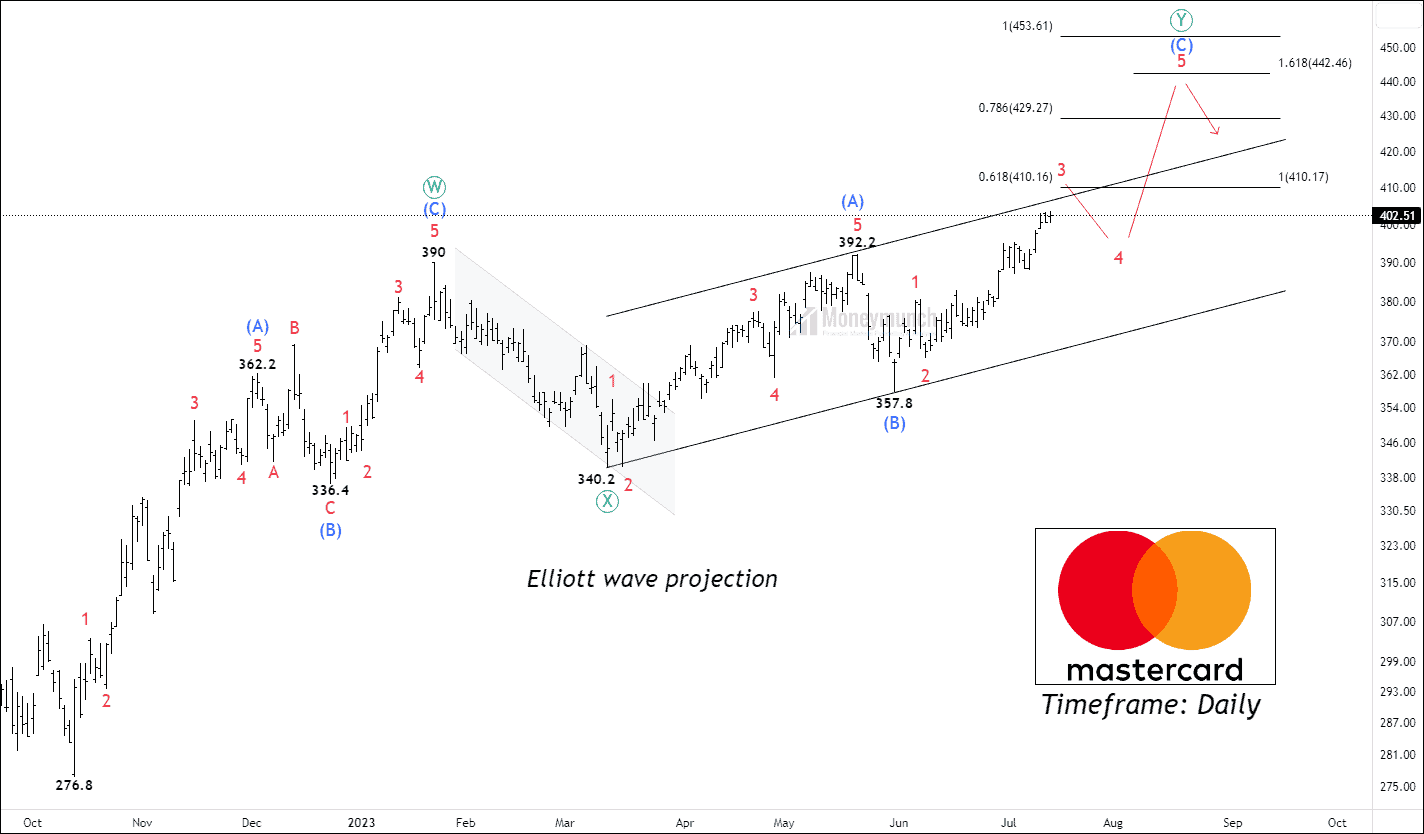
Timeframe: Daily NYSE MA has started a double zigzag at the low of $26.8. Price has accomplished wave w at $390 and wave ((X)) at $340.2. The security price is moving above the 20/50/100/200 moving average with falling ATR signals sellers can come to provide a correction before the price surge.Continue reading
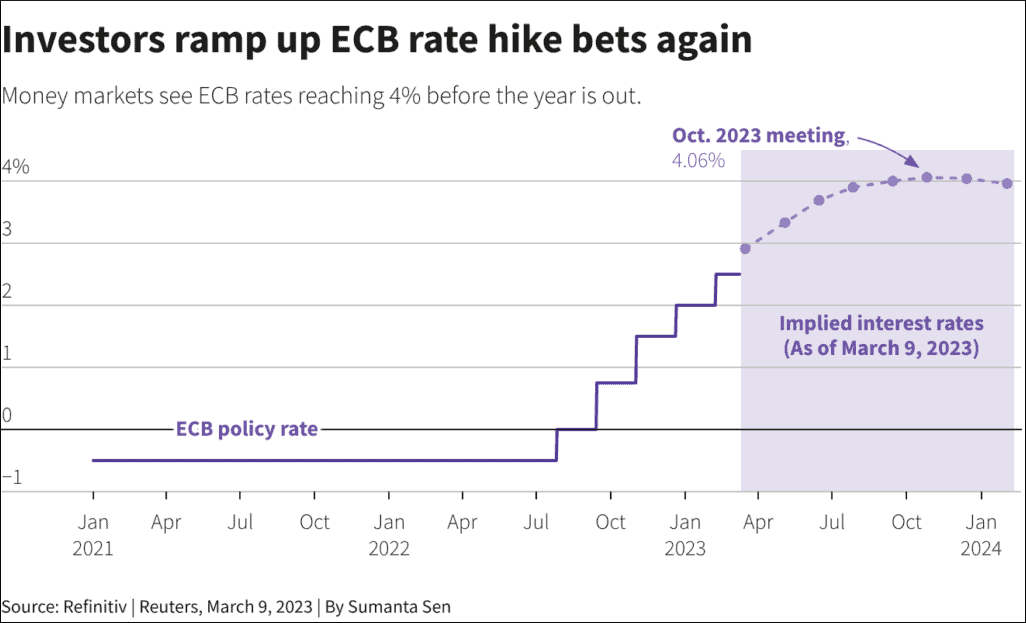
Event Alert – ECB Interest Rate Hike and Market Impact
Analyzing the Potential Impact of ECB’s Interest Rate Increase on Global and Indian Markets
 Continue reading