ATR Indicator – Market Volatility Made Simple

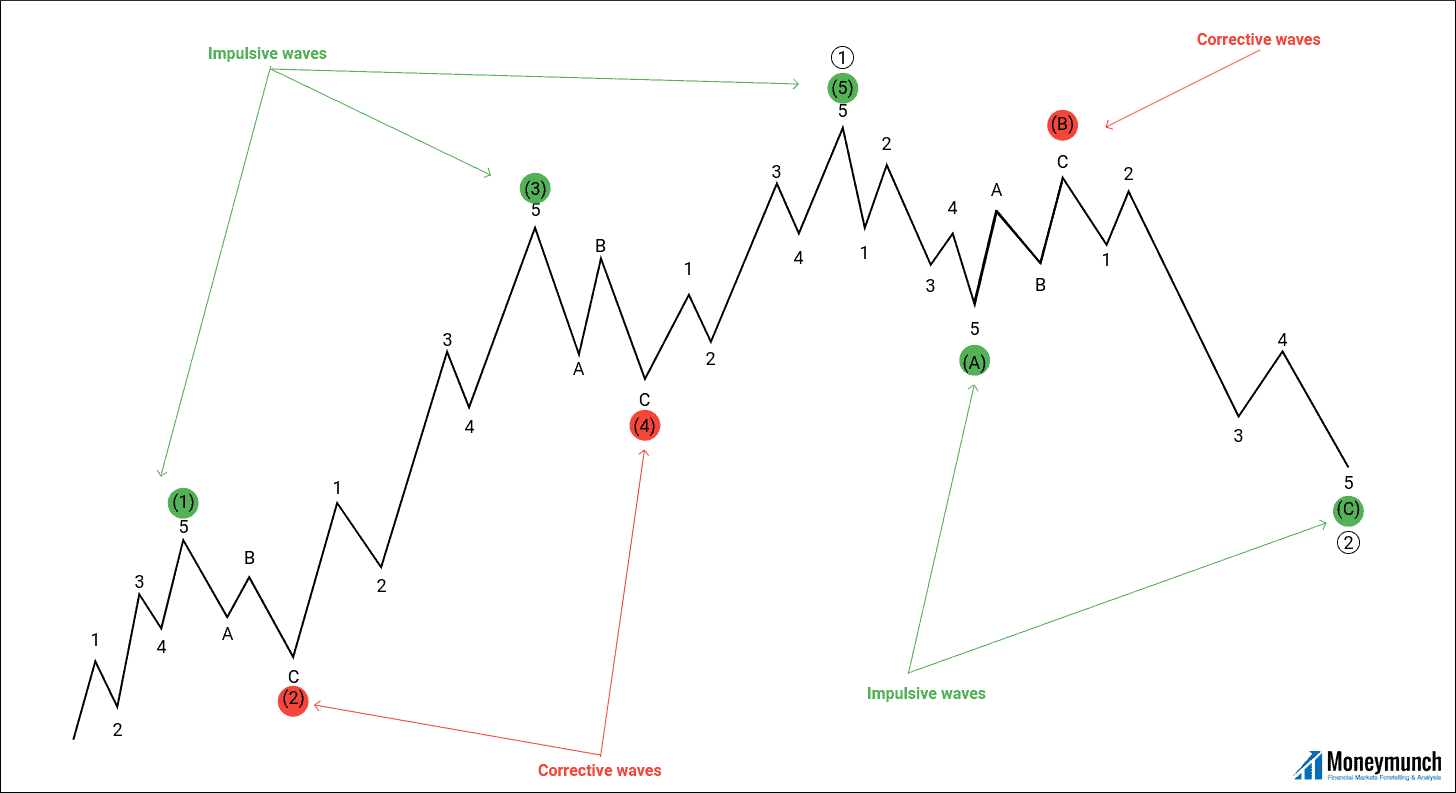
Part A – Introduction to the Wave Principle
MCX MENTHAOIL – Trade Setup
 Unlock This Article
Only subscribers can read the full article. Please login to read the entire article.
Bullish Cup and Handle Pattern
Version 2.0: Publish Date 20/11/2012
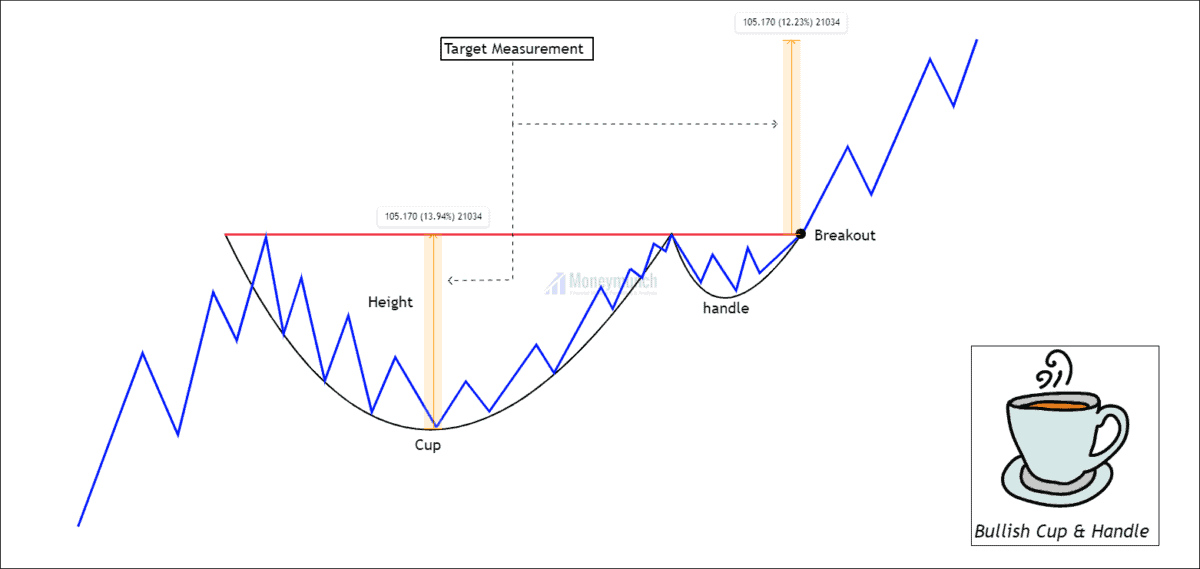
Type: bullish continuation
A cup and handle is a popular chart pattern among technicians. It had developed by William O’Neil and introduced in 1998. As the name suggests, the pattern is shaped like a cup with a handle. The shape of the cup is “U”, and the handle is pointing downward. The cup has a “U” shape and a downward-pointing handle. The ending point of the handle indicates buying opportunity. As soon as this part of the price formation is complete, the stock may reverse course and reach higher levels.
1. Prior trend: We are trading bullish continuation Cup & handle. So, the prior trend should be upward. It shows that the price will continue to trend after a retracement of the previous impulse. Buyers are generating demand to push the trend.
2. Construction: “U” shaped bottoms are an ideal pattern and more reliable than “V” bottoms because there is almost no consolidation in this case. The perfect pattern would have equal highs on both sides of the cup, but this does not often occur.
3. Duration: It is possible to spread the cup out over 1 to 6 months, and occasionally longer. The handle should form and finish over a period of 1-4 weeks.
4. Breakout: The pattern confirms a bullish trend when it breaks above the neckline formed by the previous highs with good volume. A buy point is reached when the stock breaks out or moves upward through the old resistance level (right side of the cup).
5. Volume: During the base of the bowl, the volume should decrease as prices decline, remaining lower than average; then, it should increase when the stock begins to move higher, back up to the previous high.
6. Timeframe:
- Cup and handle patterns can unfold over weeks or months.
- Adapt your trading strategy to your preferred time frame.
7. Profit targets: It is calculated based on the depth of the cup as a profit target. The breakout level can be determined by extending the distance from the bottom of the cup to the neckline and measuring upward from there.
8. Stop-loss: It is ideal to place the stop-loss at the bottom of the handle. Also, You can place the stop-loss below the swing low if the price oscillated within the handle several times.
Only subscribers can read the full article. Please login to read the entire article.
Upside Breakout Chart Pattern Rectangle
This is the 53th Day course in a series of 60-Days called “Technical Analysis Training”
You will get daily one series of this Training after 8 o’clock night (Dinner Finished)
Follow MoneyMunch.com Technical Analysis Directory and Learn Basic Education of Technical Analysis on the Indian Stock Market (NSE/BSE)

Upside Breakout Chart Pattern
Implication
A Pennant (Bullish) is considered a bullish signal, indicating that the existing uptrend may proceed.
Description
A Pennant (Bullish) observe a steep, or almost straight rise in cost, and consists of two converging trendlines that form a narrow, narrowing flag shape. The Pennant shape usually seems as a horizontal shape, rather than one with a downtrend or uptrend.
Separate from its shape, the Pennant is equivalent in all areas to the Flag. The Pennant is also comparable to the Symmetrical Triangle or Wedge continuation patterns however; the Pennant is typically shorter in duration and flies horizontally.

Trading Considerations
Inbound Trend
The constant trend is an significant characteristic of the construction. A superficial inbound improvement may indicates a length of combination before the amount move recommended by the construction begins. Look for an inbound trend that is extensive than the duration of the structure. A ideal idea of finger is that the inbound trend should be at least 2 times the duration of the construction
Continue reading