
This is the 21th Day course in a series of 60-Days called “Technical Analysis Training”
You will get daily one series of this Training after 8 o’clock night (Dinner Finished)
Follow MoneyMunch.com Technical Analysis Directory and Learn Basic Education of Technical Analysis on the Indian Stock Market (NSE/BSE)

Moving Average Convergence/Divergence (MACD) Oscillator
Implication
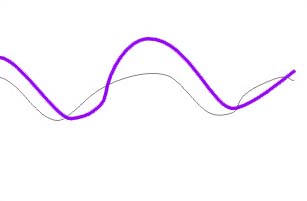
If the MACD crosses the signal line or the zero line (the event), a bullish or bearish signal is created based on the direction of the crossovers.
Description
The MACD, “Moving Average Convergence/Divergence”, tells the connection in between two moving averages of prices. The MACD is the difference between a 26-day and 12-day exponential moving average. A 9-day exponential moving average named the “signal line” is plotted on top of the MACD to give bullish and bearish signal tips. A bullish signal is created after the MACD rises above the signal line, or above zero. A bearish signal happens after the MACD comes below the signal line or below zero.
Trading Considerations
The MACD is most effective in powerfully finding trend of markets.
The MACD suggests overbought and oversold situations. An overbought situation happens whenever prices have increased too far too fast and also are set for a downward correction. An oversold situation happens whenever prices have fallen too far too fast and are set for an upward correction. When the shorter moving average pulls away from the longer moving average (i.e., the MACD rises), it’s probably that the financial instrument’s price is too high and will soon get back to more realistic levels.
An indication that an end to the current trend may be near happens whenever MACD diverges through the financial instrument’s price. A bearish divergence happens whenever MACD is making new lows while prices fail to reach new lows. A bullish divergence occurs whenever the MACD is making new highs while prices are unsuccessful to reach new highs. These two divergences are most significant when they happen at comparatively overbought/oversold levels.
Message for you(Trader/Investor): Google has the answers to most all of your questions, after exploring Google if you still have thoughts or questions my Email is open 24/7. Each week you will receive your Course Materials. You can print it and highlight for your Technical Analysis Training.
Wishing you a wonderful learning experience and the continued desire to grow your knowledge. Education is an essential part of living wisely and the Experiences of life, I hope you make it fun.
Learning how to profit in the Stock Market requires time and unfortunately mistakes which are called losses. Why not be profitable while you are learning?
TABLE OF CONTENTS
Candlestick and Chart Patterns (15 Days)
7 Most Important Candlestick Chart Patterns
- Gap Down Chart Pattern
- Gap Up Chart Pattern
- Gravestone Short-term Chart Pattern
- Hammer Candle Stick Chart Pattern
- Hanging Man Short-term Stock Chart Pattern
- Inverted Hammer Stock Chart Pattern
- Shooting Star Candle Stick Pattern
Top 2 Bearish Chart Patterns
Top 6 Bullish Chart Patterns
- Engulfing Line (Bullish) Chart Pattern
- Exhaustion Bar Chart Pattern (Bullish)
- Inside Bar Chart Pattern
- Island Bottom Chart Pattern
- Key Reversal Bar (Bullish) Chart Pattern
- Two Bar Reversal (Bullish) Chart Pattern
Indicators & Oscillators (12 Days)
Bullish or Bearish Indicators
Bullish or Bearish Oscillators
- Bollinger Bands Oscillator
- Commodity Channel Index (CCI)
- Fast Stochastic Oscillator
- Know Sure Thing (KST) Oscillator
- Momentum Oscillator
- Moving Average Convergence/Divergence (MACD) Oscillator
- Relative Strength Index (RSI)
- Slow Stochastic Oscillator
- Williams %R Oscillator
Classic Chart Patterns (29 Days)
Bearish Classic Chart Patterns
- Continuation Diamond (Bearish) Chart Pattern
- Continuation Wedge (Bearish)
- Descending Continuation Triangle Chart Pattern
- Diamond Top Chart Pattern
- Double Top Chart Pattern
- Downside Break Chart Pattern – Rectangle
- Flag Bearish Chart Pattern
- Head and Shoulders Top Chart Pattern
- Megaphone Top Chart Pattern
- Pennant Bearish Chart Pattern
- Rounded Top Chart Pattern
- Symmetrical Continuation Triangle (Bearish)
- Top Triangle/Wedge Chart Pattern
- Triple Top Chart Pattern
Bullish Classic Chart Patterns
- Ascending Continuation Triangle Chart Pattern
- Bottom Triangle Or Wedge Chart Pattern
- Continuation Diamond (Bullish) Chart Pattern
- Continuation Wedge Chart Pattern (Bullish)
- Cup with Handle Bullish Chart Pattern
- Diamond Bottom Chart Pattern
- Double Bottom Chart Pattern
- Flag Bullish Chart Pattern
- Head and Shoulders Bottom Chart Pattern
- Megaphone Bottom Chart Pattern
- Pennant Bullish Chart Pattern
- Round Bottom Chart Pattern
- Symmetrical Continuation Triangle Bullish
- Triple Bottom Chart Pattern
- Upside Breakout Chart Pattern – Rectangle
Best Trading Theories (4 Days)
- Basics of Dow theory trading strategy forecasts
- Motive (Impulse) Waves
- Corrective Waves
- Wyckoff Chart Reading
Kind attention: this course is helpful for beginner and intermediate traders. It’s free for everyone. Advanced modules, trading strategies, and data (in-depth) are available for Moneymunch’s premium subscribers.
Get free important share market ideas on stocks & nifty tips chart setups, analysis for the upcoming session, and more by joining the below link: Stock Tips
Have you any questions/feedback about this article? Please leave your queries in the comment box for answers.
Excellent, my dear sirs. Never before have I come across such a highly informative and valuable tutorial. And that too Free to learn ! Thanks to the magnanimity. Please continue the good gesture. Thanks again.