
This is the 23th Day course in a series of 60-Days called “Technical Analysis Training”
You will get daily one series of this Training after 8 o’clock night (Dinner Finished)
Follow MoneyMunch.com Technical Analysis Directory and Learn Basic Education of Technical Analysis on the Indian Stock Market (NSE/BSE)

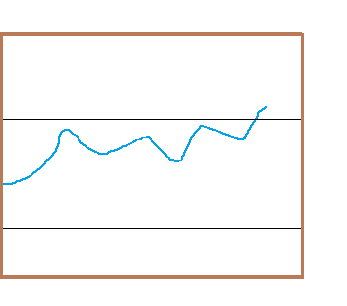
Relative Strength Index (RSI)
Implication
When the RSI falls below 30 (a Technical Analysis), a bullish signal is generated. When the RSI rises above 70, the Technical Analysis is a bearish signal.
Description
The Relative Strength Index (RSI) is an oscillator that measures a particular financial instrument’s current relative strength compared to its own price history. The RSI should not be confused with relative strength which rates a financial instrument in relation to a market such as the S&P index.
The RSI is plotted on a vertical scale numbered from 0 to 100. The formula to calculate the RSI is 100-[100/(1+A)] where A is the average of the “up” closes over the calculation period divided by the average of the “down” closes over the calculation period.
Different calculation periods can be used. The most popular is a 14-day period. The “A” for a 14-day period is calculated by dividing the 14-day “up” close average by the 14-day “down” close average. An “up” close or a “down” close is defined as the absolute change in price from close to close.
Trading Considerations
The RSI sometimes shows more clearly than the price chart itself the support and resistance lines for a financial instrument. Failure Swings which are also known as support or resistance penetrations or breakouts can be detected by using the RSI. Failure swings occur when the RSI passes a previous high or falls below a recent low.
Divergences (when market trends go in a different direction than market indicators predicted, usually signifying the onset of a trend change) occur when the price makes a new high (or low) that is not confirmed by a new high (or low) in the RSI. Prices usually correct and move in the direction of the RSI.
A financial instrument is considered to be oversold when its RSI falls below 30 and overbought when its RSI rises over 70.Message for you(Trader/Investor): Google has the answers to most all of your questions, after exploring Google if you still have thoughts or questions my Email is open 24/7. Each week you will receive your Course Materials. You can print it and highlight for your Technical Analysis Training.
Message for you(Trader/Investor): Google has the answers to most all of your questions, after exploring Google if you still have thoughts or questions my Email is open 24/7. Each week you will receive your Course Materials. You can print it and highlight for your Technical Analysis Training.
Wishing you a wonderful learning experience and the continued desire to grow your knowledge. Education is an essential part of living wisely and the Experiences of life, I hope you make it fun.
Learning how to profit in the Stock Market requires time and unfortunately mistakes which are called losses. Why not be profitable while you are learning?
TABLE OF CONTENTS
Candlestick and Chart Patterns (15 Days)
7 Most Important Candlestick Chart Patterns
- Gap Down Chart Pattern
- Gap Up Chart Pattern
- Gravestone Short-term Chart Pattern
- Hammer Candle Stick Chart Pattern
- Hanging Man Short-term Stock Chart Pattern
- Inverted Hammer Stock Chart Pattern
- Shooting Star Candle Stick Pattern
Top 2 Bearish Chart Patterns
Top 6 Bullish Chart Patterns
- Engulfing Line (Bullish) Chart Pattern
- Exhaustion Bar Chart Pattern (Bullish)
- Inside Bar Chart Pattern
- Island Bottom Chart Pattern
- Key Reversal Bar (Bullish) Chart Pattern
- Two Bar Reversal (Bullish) Chart Pattern
Indicators & Oscillators (12 Days)
Bullish or Bearish Indicators
Bullish or Bearish Oscillators
- Bollinger Bands Oscillator
- Commodity Channel Index (CCI)
- Fast Stochastic Oscillator
- Know Sure Thing (KST) Oscillator
- Momentum Oscillator
- Moving Average Convergence/Divergence (MACD) Oscillator
- Relative Strength Index (RSI)
- Slow Stochastic Oscillator
- Williams %R Oscillator
Classic Chart Patterns (29 Days)
Bearish Classic Chart Patterns
- Continuation Diamond (Bearish) Chart Pattern
- Continuation Wedge (Bearish)
- Descending Continuation Triangle Chart Pattern
- Diamond Top Chart Pattern
- Double Top Chart Pattern
- Downside Break Chart Pattern – Rectangle
- Flag Bearish Chart Pattern
- Head and Shoulders Top Chart Pattern
- Megaphone Top Chart Pattern
- Pennant Bearish Chart Pattern
- Rounded Top Chart Pattern
- Symmetrical Continuation Triangle (Bearish)
- Top Triangle/Wedge Chart Pattern
- Triple Top Chart Pattern
Bullish Classic Chart Patterns
- Ascending Continuation Triangle Chart Pattern
- Bottom Triangle Or Wedge Chart Pattern
- Continuation Diamond (Bullish) Chart Pattern
- Continuation Wedge Chart Pattern (Bullish)
- Cup with Handle Bullish Chart Pattern
- Diamond Bottom Chart Pattern
- Double Bottom Chart Pattern
- Flag Bullish Chart Pattern
- Head and Shoulders Bottom Chart Pattern
- Megaphone Bottom Chart Pattern
- Pennant Bullish Chart Pattern
- Round Bottom Chart Pattern
- Symmetrical Continuation Triangle Bullish
- Triple Bottom Chart Pattern
- Upside Breakout Chart Pattern – Rectangle
Best Trading Theories (4 Days)
- Basics of Dow theory trading strategy forecasts
- Motive (Impulse) Waves
- Corrective Waves
- Wyckoff Chart Reading
Kind attention: this course is helpful for beginner and intermediate traders. It’s free for everyone. Advanced modules, trading strategies, and data (in-depth) are available for Moneymunch’s premium subscribers.
Get free important share market ideas on stocks & nifty tips chart setups, analysis for the upcoming session, and more by joining the below link: Stock Tips
Have you any questions/feedback about this article? Please leave your queries in the comment box for answers.