This is the 24th Day course in a series of 60-Days called “Technical Analysis Training”
You will get daily one series of this Training after 8 o’clock night (Dinner Finished)
Follow MoneyMunch.com Technical Analysis Directory and Learn Basic Education of Technical Analysis on the Indian Stock Market (NSE/BSE)

Williams %R Oscillator
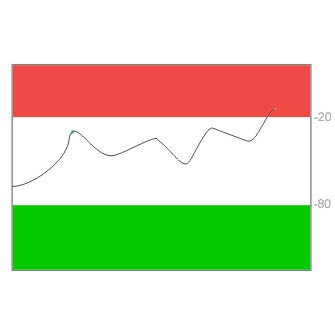
Bullish: %R goes up again above -80 and remains to traverse above the -50 line within 14 days. We recognize an function at the -50 line borrowing.
Bearish: %R reduces back here -20 and keeps going to cross just below the -50 line just in 14 days. We recognize an occasion at the -50 line borrowing.
Description
The %R oscillator is very similar to the stochastic oscillator. However, the %R oscillator is expressed in negative values. For simplicity, many technical analysts would suggest that you ignore the negative symbols altogether. The goal of the %R oscillator is to detect overbought or oversold conditions. According to John J. Murphy, the %R oscillator measures “the latest close in relation to its price range over a given number of days”. The specific calculation for the %R oscillator is freely available on the web and other resources. Recognia uses a 14-day period to detect events, which is the typical period to monitor.
Trading Considerations
When the %R line nears the -80% line an oversold condition may occur, causing a price reversal. Likewise, when the %R line nears the -20% line an overbought condition may occur. Some technical analysts prefer to use the -75% and -25% lines to indicate oversold/overbought conditions.
It should be pointed out that an event at the -80% or -20% lines does not necessitate a price reversal. In fact, the price can continue to rise or fall.
Divergence will give you a better sense of the likelihood of a price reversal. Divergence occurs when the price and oscillator trend lines move in different directions. When a divergence occurs, a price reversal may follow.
Message for you(Trader/Investor): Google has the answers to most all of your questions, after exploring Google if you still have thoughts or questions my Email is open 24/7. Each week you will receive your Course Materials. You can print it and highlight for your Technical Analysis Training.
Wishing you a wonderful learning experience and the continued desire to grow your knowledge. Education is an essential part of living wisely and the Experiences of life, I hope you make it fun.
Learning how to profit in the Stock Market requires time and unfortunately mistakes which are called losses. Why not be profitable while you are learning?
TABLE OF CONTENTS
Candlestick and Chart Patterns (15 Days)
7 Most Important Candlestick Chart Patterns
- Gap Down Chart Pattern
- Gap Up Chart Pattern
- Gravestone Short-term Chart Pattern
- Hammer Candle Stick Chart Pattern
- Hanging Man Short-term Stock Chart Pattern
- Inverted Hammer Stock Chart Pattern
- Shooting Star Candle Stick Pattern
Top 2 Bearish Chart Patterns
Top 6 Bullish Chart Patterns
- Engulfing Line (Bullish) Chart Pattern
- Exhaustion Bar Chart Pattern (Bullish)
- Inside Bar Chart Pattern
- Island Bottom Chart Pattern
- Key Reversal Bar (Bullish) Chart Pattern
- Two Bar Reversal (Bullish) Chart Pattern
Indicators & Oscillators (12 Days)
Bullish or Bearish Indicators
Bullish or Bearish Oscillators
- Bollinger Bands Oscillator
- Commodity Channel Index (CCI)
- Fast Stochastic Oscillator
- Know Sure Thing (KST) Oscillator
- Momentum Oscillator
- Moving Average Convergence/Divergence (MACD) Oscillator
- Relative Strength Index (RSI)
- Slow Stochastic Oscillator
- Williams %R Oscillator
Classic Chart Patterns (29 Days)
Bearish Classic Chart Patterns
- Continuation Diamond (Bearish) Chart Pattern
- Continuation Wedge (Bearish)
- Descending Continuation Triangle Chart Pattern
- Diamond Top Chart Pattern
- Double Top Chart Pattern
- Downside Break Chart Pattern – Rectangle
- Flag Bearish Chart Pattern
- Head and Shoulders Top Chart Pattern
- Megaphone Top Chart Pattern
- Pennant Bearish Chart Pattern
- Rounded Top Chart Pattern
- Symmetrical Continuation Triangle (Bearish)
- Top Triangle/Wedge Chart Pattern
- Triple Top Chart Pattern
Bullish Classic Chart Patterns
- Ascending Continuation Triangle Chart Pattern
- Bottom Triangle Or Wedge Chart Pattern
- Continuation Diamond (Bullish) Chart Pattern
- Continuation Wedge Chart Pattern (Bullish)
- Cup with Handle Bullish Chart Pattern
- Diamond Bottom Chart Pattern
- Double Bottom Chart Pattern
- Flag Bullish Chart Pattern
- Head and Shoulders Bottom Chart Pattern
- Megaphone Bottom Chart Pattern
- Pennant Bullish Chart Pattern
- Round Bottom Chart Pattern
- Symmetrical Continuation Triangle Bullish
- Triple Bottom Chart Pattern
- Upside Breakout Chart Pattern – Rectangle
Best Trading Theories (4 Days)
- Basics of Dow theory trading strategy forecasts
- Motive (Impulse) Waves
- Corrective Waves
- Wyckoff Chart Reading
Kind attention: this course is helpful for beginner and intermediate traders. It’s free for everyone. Advanced modules, trading strategies, and data (in-depth) are available for Moneymunch’s premium subscribers.
Get free important share market ideas on stocks & nifty tips chart setups, analysis for the upcoming session, and more by joining the below link: Stock Tips
Have you any questions/feedback about this article? Please leave your queries in the comment box for answers.